Versão HTML básica


353
Serum concentrations of nitrite and malondialdehyde as markers of oxidative stress in chronic myeloid leukemia patients treated with tyrosine kinase inhibitors
Rev Bras Hematol Hemoter. 2012;34(5):352-5
Methods
This is a cross-sectional study of 64 adult patients diagnosed
with CML according to the criteria of the World Health
Organization (WHO) classification
(17)
, treated in the hematology
service of a referral hospital in Fortaleza, Ceará.
The group of patients consisted of 34 women (53.1%) and
30 men (46.9%), with ages that ranged from 20 to 80 years and
with a median age of 44 years. The patients were stratified into
two groups according to treatment: imatinib (n = 31) and second-
generation TKIs (dasatinib and nilotinib - n = 33). Patients were
excluded if they were smokers, drank alcohol, were drug addicts
or took vitamins with antioxidant action.
The level of malondialdehyde (MDA) in heparinized
plasma was calculated by determining the quantity of reactive
substances using thiobarbituric acid (TBARS) at a temperature
of 100°C. The absorbance of the colored MDA-TBARS complex
was measured by spectrophotometry at a wavelength of 560
nm
(18)
. Nitrite levels in heparinized plasma were determined
using Green’s method where nitrite in an acid medium reacts
with sulfanilamide. The resulting diazo compound reacts with
N-naphthyl-ethylenediamine (NEED), thereby generating a
compound with an intense red color. Absorbance was measured
by spectrophotometry at a wavelength of 540 nm
(19)
.
All subjects signed written consent forms and the
study was approved by the Research Ethics Committee of
the Universidade Federal do Ceará, under protocol number
042.05.10 which is in accordance with Resolution 196/96 of
the National Health Council.
The GraphPrism (version 5.01) program was used for
statistical analysis. The Kolmogorov-Smirnov test was used to
check for normal distribution of the data. Statistical differences
between groups were identified using the Student t-test and
Fisher’s exact test with the significance level being set for a
p-value < 0.05 in all analyses. The results are expressed as means
± standard error of mean (SEM).
Results
The clinical characteristics of patients in the study are shown
in Table 1. There were no significant differences for gender,
current age, age at diagnosis and time since diagnosis between
the groups (p-value > 0.05).
Of the 33 patients treated with second-generation TKIs, 15
(44.5%) had high Sokal risk at diagnosis, whereas this finding
was observed in five patients (16.1%) in the group treated with
imatinib (p-value < 0.05). In relation to disease progression, 21
patients (63.6%) treated with second-generation TKIs were in the
accelerated or blast crisis phases, while this was observed in six
patients (19.5%) treated with imatinib (p-value < 0.05).
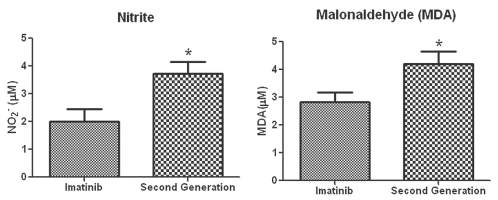
The mean level of nitrite in the plasma of CML patients was
2.638 ± 0.327 mM and the mean level of MDAwas 3.582 ± 0.306
mM. On stratifying the CML patients according to treatment,
it was observed that serum levels of nitrite and MDA were
significantly higher in patients treated with second-generation
TKIs than those treated with imatinib (Figure 1 and Table 1).
Discussion
CML accounts for approximately 14% of all leukemias with
an annual incidence of one to two cases per 100,000 inhabitants
and a slight predominance of men
(20,21)
. It affects all ages, but the
incidence rises with age
(21)
. The average age at diagnosis is 55 to
60 years, with less than 10% of patients being younger than 20
years old
(21,22)
. In the present study, no significant difference in
the incidence of the disease between genders was found, however
there was a slight predominance of males, which agrees with
published data. The mean age at diagnosis was 44 years in the
Table 1 - Analysis of measurements of Imatinib and 2
nd
-generation tyrosine kinase inhibitors Groups on day D-1
Parameter
CML (n = 64)
Imatinib (n = 31)
2nd-generation (n = 33)
p-value
Gender (male/female)
34/30
16/15
18/15
0.5062
Age (years) - mean ± SE
45.30 ± 2.08
43.92 ± 2.99
46.63 ± 2.93
0.2609
a
Age at diagnosis (years) - mean ± SE
44.22 ± 2.01
41.64 ± 2.78
46.17 ± 2.80
0.1345
a
Time since diagnosis (years) - mean ± SE
7.755 ± 0.54
7.200 ± 0.99
8.778 ± 0.86
0.1296
a
High Sokal risk – n (%)
20 (31.2)
5 (16.1)
15 (44.5)
0.0215
b
Accelerated phase + blast crisis - n (%)
27 (42.2)
6 (19.5)
21 (63.6)
0.0014
b
Nitrite (µM) - mean ± SE
2.638 ± 0.327
2.010 ± 0.449
3.730 ± 0.429
< 0.0001
a
MDA (µM) - mean ± SE
3.582 ± 0.306
2.818 ± 0.349
4.197 ± 0.445
< 0.01
a
CML: chronic myeloid leukemia; MDA: malondialdehyde
a
Student t-test;
b
Fisher’s exact Test; statistically significance < 0.05
Figure 1 - Nitrite and malondialdehyde levels in chronic myeloid leukemia
patients according to treatment
Student t-test * p-value < 0.05